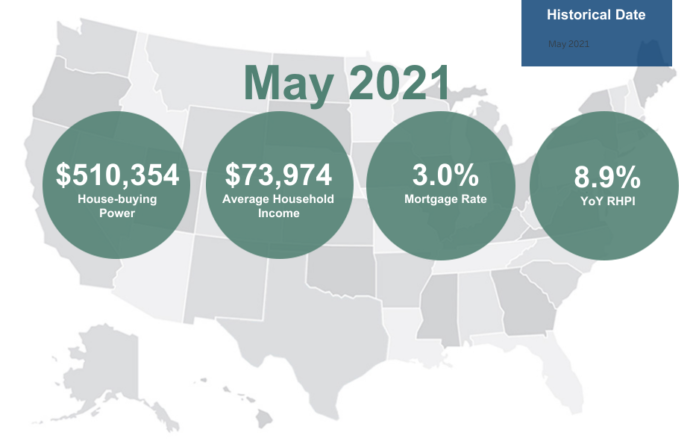
The chief economist’s analysis of First American Financial Corporation’s May 2021 First American Real House Price Index (RHPI) shows record nominal house price appreciation outpaces house-buying power growth in May. The index measures the price changes of single-family properties throughout the U.S., adjusted for the impact of income and interest rate changes on consumer house-buying power over time.
“Housing affordability declined on a year-over-year basis for the third month in a row in May, following a two-year streak of rising affordability,” says Mark Fleming, chief economist at First American. “The decline in May occurred even as two of the three key drivers of the Real House Price Index, household income and mortgage rates, swung in favor of greater affordability relative to one year ago. House-buying power increased by 8 percent in May compared with a year ago, propelled by lower mortgage rates and higher household income. The affordability gains from house-buying power, however, were offset by the third component of the RHPI, nominal house price appreciation, which reached a record 18 percent in May, surpassing the previous peak from 2005.”
“The drop in affordability was broadly felt as affordability declined year over year in 49 of the 50 markets we track,” explains Fleming. “The five markets with the greatest year-over-year decline in affordability were Phoenix (-22.7 percent), Seattle (-20.1 percent), Kansas City, Mo. (-19.6 percent), Tampa, Fla. (-17.8 percent) and Las Vegas (-17.2 percent). In May, Phoenix had the greatest year-over-year decrease in affordability. While annual income growth was steady at 1.9 percent, Phoenix experienced the biggest annual increase in nominal house prices of any major market: 29.3 percent. The steep increase in nominal house prices overshadowed any affordability gains from increased house-buying power. A similar dynamic played out in Tampa as year-over-year nominal house price appreciation of 25.6 percent outpaced house-buying power.”
“In Seattle and Las Vegas, house-buying power ticked up as the positive impact of falling mortgage rates offset a decline in household incomes. However, like Phoenix and Tampa, nominal house price growth in Seattle (20.7 percent) and Las Vegas (19.9 percent) overshadowed the house-buying power gains,” says Fleming. “Kansas City was the only one of the five markets where house-buying power declined, combining with faster house price appreciation to drive a decline in affordability.”
Real house prices increased 0.7 percent between April 2021 and May 2021. Real house prices increased 8.9 percent between May 2020 and May 2021. Consumer house-buying power, how much one can buy based on changes in income and interest rates, increased 1.4 percent between April 2021 and May 2021, and increased 8.4 percent year over year. Median household income has increased 4.7 percent since May 2020 and 78.0 percent since January 2000. Real house prices are 19.9 percent less expensive than in January 2000. While unadjusted house prices are now 30.1 percent above the housing boom peak in 2006, real, house-buying power-adjusted house prices remain 43.8 percent below their 2006 housing boom peak.
The five states with the greatest year-over-year increase in the RHPI are: Arizona (+19.4 percent), Vermont (+17.0 percent), Washington (+16.6 percent), Nevada (+16.3 percent), and Connecticut (+15.4 percent). There were no states with a year-over-year decrease in the RHPI.
Among the Core Based Statistical Areas (CBSAs) tracked by First American, the five markets with the greatest year-over-year increase in the RHPI are: Phoenix (+22.7 percent), Seattle (+20.1 percent), Kansas City, Mo. (+19.6 percent), Tampa, Fla. (+17.8 percent), and Las Vegas (+17.2 percent). Among the CBSAs tracked by First American, the only market with a year-over-year decrease in the RHPI is San Francisco (-0.1 percent).


