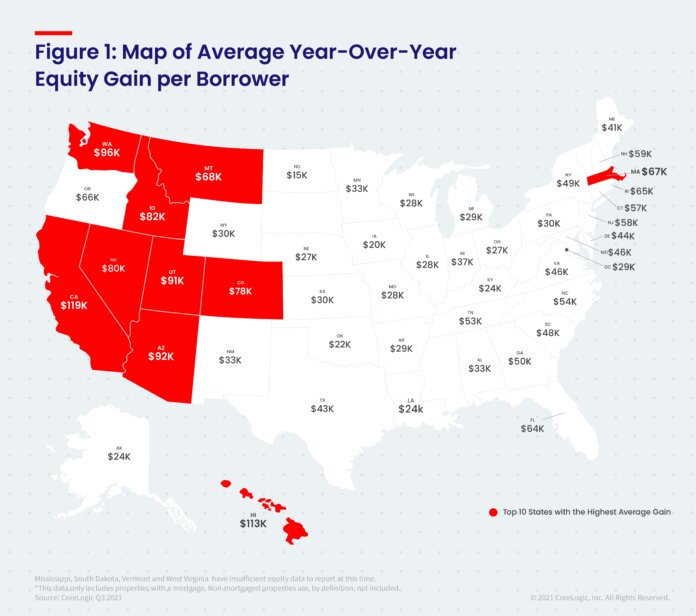
CoreLogic, a global property information, analytics and data-enabled solutions provider, has released the Homeowner Equity Report for the third quarter of 2021. The report shows U.S. homeowners with mortgages – which account for roughly 63% of all properties – have seen their equity increase by 31.1% year over year, representing a collective equity gain of over $3.2 trillion, and an average gain of $56,700 per borrower, since the third quarter of 2020.
This summer, home price growth reached the highest level in more than 45 years, pushing equity gains to another record high and allowing 70,000 properties to regain equity in the third quarter of 2021. These equity gains provided a crucial barrier against foreclosure for the 1.2 million borrowers who reached the end of forbearance in September.
“Not only have equity gains helped homeowners more seamlessly transition out of forbearance and avoid a distressed sale, but they’ve also enabled many to continue building their wealth,” said Frank Martell, president and CEO of CoreLogic. “This financial reserve will be especially helpful for homeowners looking to fund renovation projects.”
“Home price growth is the principal driver of home equity creation,” says Dr. Frank Nothaft, chief economist for CoreLogic. “The CoreLogic Home Price Index reported home prices were up 17.7% for the past 12 months ending September, spurring the record gains in home equity wealth.”
Negative equity, also referred to as underwater or upside-down mortgages, applies to borrowers who owe more on their mortgages than their homes are currently worth. Quarterly change: From the second quarter of 2021 to the third quarter of 2021, the total number of mortgaged homes in negative equity decreased by 5.7% to 1.2 million homes, or 2.1% of all mortgaged properties.
In the third quarter of 2020, 1.6 million homes, or 3% of all mortgaged properties, were in negative equity. This number decreased by 28.9%, or approximately 470,000 properties, in the third quarter of 2021.
The national aggregate value of negative equity was approximately $276.2 billion at the end of the third quarter of 2021. This is up quarter over quarter by approximately $8.2 billion, or 3%, from $268 billion in the second quarter of 2021, and down year over year by approximately $8.3 billion, or 2.9%, from $284.5 billion in the third quarter of 2020.
Because home equity is affected by home price changes, borrowers with equity positions near (+/- 5%) the negative equity cutoff are most likely to move out of or into negative equity as prices change, respectively. Looking at the third quarter of 2021 book of mortgages, if home prices increase by 5%, 145,000 homes would regain equity; if home prices decline by 5%, 191,000 would fall underwater.
The next CoreLogic Homeowner Equity Report will be released in March 2022, featuring data for Q4 2021.
Over 3,000 consumers were surveyed by CoreLogic via Qualtrics. The study is an annual pulse of U.S. housing market dynamics concentrated on consumers looking to purchase a home, consumers not looking to purchase a home and current mortgage holders. The survey was conducted in April 2021 and hosted on Qualtrics. The survey has a sampling error of ~3% at the total respondent level with a 95% confidence level.


